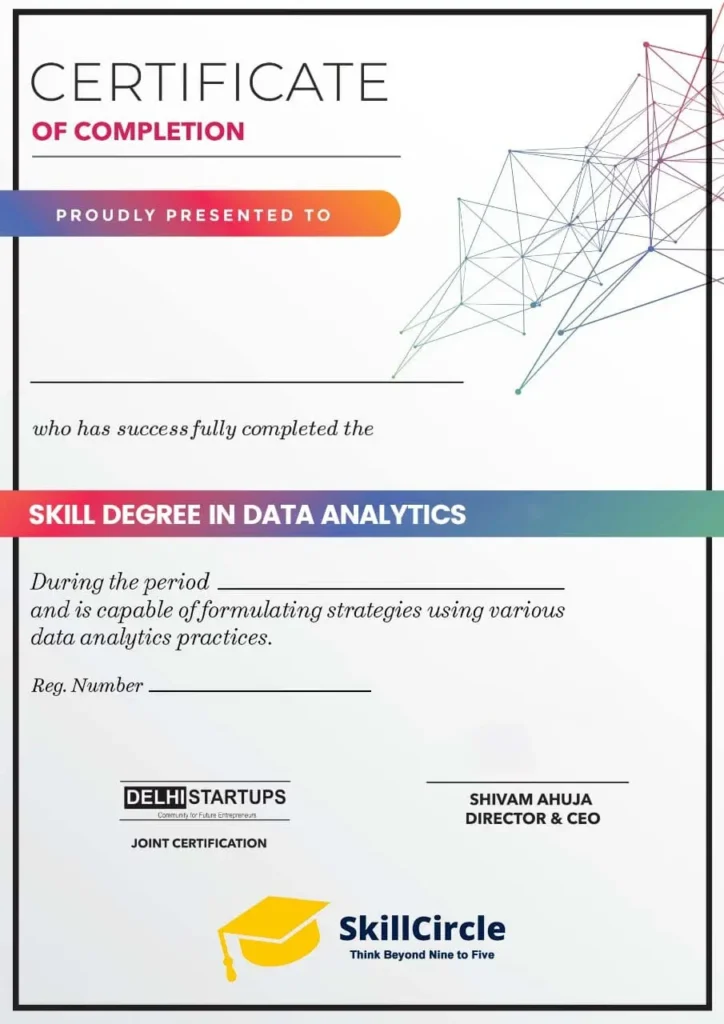
Skill Degree in Data Analytics
- More Than 10k+ Students
- 80% Students Placed
- 5.9 LPA Average CTC
- 10 LPA Highest CTC
- 100+ Expert Mentors
- 8 Years in Industry
- 50+ Hiring Parteners
- Hybrid Classes
- 100% Job Placement
- 4.7 Rating on Google

Course Description
Discover the world of data analytics at Skill Circle, where our comprehensive course covers fundamental principles such as data collection and exploration. Gain proficiency in data manipulation and analysis using industry-standard tools like Python and SQL. Additionally, learn to transform raw data into compelling visual narratives with Power Bl, creating interactive dashboards that convey insights effectively. Dive into advanced analytics using Tableau, where you’ll uncover patterns and trends through sophisticated visualizations.
When you choose Skill Circle, you benefit from experienced instructors offering practical insights and real-world applications. Apply your skills to hands-on projects, building a robust portfolio that showcases your proficiency. Our flexible learning options are designed to accommodate both full-time professionals and students.
Program Key Features
- 4 Months of Live Advance Learning.
- Advanced Stimulation Training with Student
- 14+ Modules with Globally Recognised Certification
- 10+ Capstone Projects with Dedicated Mentors from Industry
- Interview Preparation Sessions by HR working at naukri.com
- 100% Placement Assistance at our inHouse #Jobcircle Portal
What You’ll Learn From This Course?
- The functioning of the Digital Landscape
- Auditing the brands digitally
- Digital strategy and planning along with latest tools, trends and practices
- Working on live projects under expert guidance
- Advanced courses like, Domain Flipping, Freelancing, Podcast Marketing, and Personality Development.
Why you should learn Data Analytics?
⦁ Smart Decision-Making: Data Analytics empowers you to make informed decisions by revealing patterns and insights within large sets of information.
⦁ Career Advancement: Acquiring Data Analytics skills enhances your employability, as industries increasingly
⦁ Problem-Solving: Become a problem solver by using data-driven approaches to address challenges and find effective solutions.
⦁ Technological Impact: Gain the ability to leverage technology for positive change, applying Data Analytics in various fields for real-world impact.
⦁ Creative Expression: Data Analytics is not just about numbers; it’s a canvas for creativity. Visualize data to tell compelling stories and make information accessible.
⦁ Global Relevance: In a world driven by data, learning Data Analytics provides you with a universal language to navigate and understand the dynamics of various industries worldwide.
Program Curriculum
- Introduction to Data Analytics
- Introduction to Data Science
- Applications and impact in various industries
- Benifits of Data Analytics for Businesses.
- Basics for Excel
- Data Formatting
- Data Calculations
- Data Automation
- Sorting and Flteration
- IF Functions
- COUNTIF, SUMIF
- VLOOKUP
- Pivot Tables
- Analysis using
- Pivot Table
- Charts
- Dashboarding
- Variables in
- Qualitative and Quantitative
- Population and Sampling
- Sampling Techniques
- Measure Of Central Tendency
- Measure of Dispersion
- Normal Distribution
- Skewness and Kurtosis
- Hypothesis Testing
- Methods
- T-Test I Z-Test I Chi-Square Test
- ANOVA
- Probability basics
- Common probability distributions
- Sampling and the Central Limit Theorem
- Introduction to Python
- Syntax Understanding in Python
- Variables in python
- Operators in python
- Built-in keywords and Methods in Python
- Data Types in Python
- Data Structures in Python
- Flow Control Statements
- If Else Statements
- Loops
- Defining a Function
- Lambda, Map, Reduce and Filter functions
- Classes and Objects (OOPs)
- Constructors in Python.
- Destructors in Python.
- Inheritance in Python
- File Handling and Exceptions
- Introduction to Exploratory Data Analytics
- Libraries and Modules used for EDA
- Import and Export Data.
- Getting Data from Web Sources
- Introduction to NumPy and its importance in EDA
- Introduction to Array's
- Numpy arrays: Creating, indexing, and slicing
- Array reshaping and dimensions
- Concatenating and splitting arrays
- Array filtering and boolean indexing
- Array sorting and searching
- Working with missing data
- Basic statistical functions in NumPy
- Linear algebra operations with NumPy
- Random number generation with NumPy
- Introduction to Pandas and its role in EDA
- Series and DataFrame data structures
- Data indexing, selection, and filtering
- Basic operations on Series and DataFrames
- Handling missing data in Pandas
- Data deduplication and data type conversion
- Merging and joining DataFrames
- Working with time series data
- Descriptive statistics and data summarization
- Grouping and aggregation in Pandas
- Pivot tables with pandas
- Working with text data in Pandas
- Introduction to data visualization and its importance in EDA
- Basic Visualizations concepts (figure, axes, plots)
- Understanding Line plots, scatter plots, and bar plots etc.
- Basic Plotting with Matplotlib
- Introduction to Matplotlib
- Create Basic Plots
- Customization of Plots
- Plot's Formatting
- Adding Annotations
- Creating Subplots and Multiple Plots
- Creating Subplots
- Adding multiple plots
- Grid and Complex Layouts
- Understanding Seaborn Library
- Default Statistical Plots
- Line Plot, Scatter Plot, Bar Plot,
- Histograms, Box
- Plots, Violin Plots, Heatmaps etc.
- Customized Plots
- Categorical Data Plotting
- Distribution Plots
- Dist Plots
- Kernel Distribution estimators plots (KDE)
- Regression Plots
- Concept of Plotly
- Understanding Plotly with its benifits
- Plots using Plotlu
- Line, Scatter, Bar plot, Pir Chart,
- Heatmaps, Area
- Charts etc.
- 3D Plots with Plotly
- 3D Scatter Plos,
- 3D Line charts
- Annotations and Text Addition
- Geographical Plotting with Plotly
- Visualization with Maps
- Geo Spatial Data Mapping
There will be at least 10 Data Analytics Capstone Projects available according to the different industries:
- BFSI - 2
- FMCG - 2
- Healthcare - 2
- Automobile - 2
- Entertainment - 2
There will be at least 10 Data Analytics Capstone Projects available according to the different industries:
- BFSI - 2
- FMCG - 2
- Healthcare - 2
- Automobile - 2
- Entertainment - 2
Introduction to Databases and SQL
- What is a database?
- Introduction to SQL (Structured Query Language)
- Key database concepts (tables, rows, columns)
- Setting up MySQL (or MySQL Workbench)
- Basic SQL queries (SELECT, FROM, WHERE)
- Inserting data into tables (INSERT INTO)
- Updating existing data (UPDATE)
- Deleting data (DELETE FROM)
- Creating and modifying tables (CREATE TABLE, ALTER TABLE)
- Aggregating data using functions (SUM, AVG, COUNT, etc.)
- GROUP BY clause for data grouping
- HAVING clause for filtering grouped data
- Understanding table relationships (foreign keys}
- INNER JOIN, LEFT JOIN, RIGHT JOIN
- Using subqueries for complex queries
Introduction to Power Bl and Data Sources
- Overview of Power Bl and its components
- Installing Power Bl Desktop
- Connecting to various data sources (Excel, databases, web data, etc.}
- Loading and transforming data in the Power Query Editor
Data Modeling in Power Bl
- Introduction to data modeling concepts
- Creating relationships between tables
- DAX (Data Analysis Expressions} basics
- Measures and calculated columns
Data Visualization with Power Bl
- Creating different types of visualizations (bar charts, line charts, pie charts, etc.}
- Customizing visual elements (colors, fonts, titles}
- Interactivity with slicers and filters
- Drill-through and drill-down
Power Bl for Reports and Dashboards
- Building interactive reports and dashboards
- Layout and design considerations
- Publishing and sharing reports on the Power Bl Service
Capstone Projects

Managing Credit Card Risks

Advanced House Price Prediction

Bank Loan Default Classification

Analytics on HR Decision

Youtube Viewers Predictions

Twitter
Analysis

Super Store Analytics

AI Chat
Box

Buying and Selling Cars Prediction

Flight Price Prediction
Flight Price Prediction
Hiring Partners
Learning Outcomes
There are many fields will be open after doing successfully Data Analytics Course Student can become….

Data Engineer

ML Engineer

Data Scientist

Business Analytics

Data Architect

AI Engineer

Data Administrator

Data Analytics
Meet Your Mentors
We have more than 100+ mentors.
Amit Gupta
VP Amar Ujala

Pranav Jha
Founder : AP Web World

Nishkarsh Sharma
Dropshipping Expert

Parul Mehta Bhargava
Founder: vCommission

Girish Singh
Uber: Head of Marketing

Amit Chawla
Business Clarity Coach

Success Journey